
Sounds complicated? It is. But to break it down, we will look at an example that most people are familiar with: chocolate ice cream.
Let's start with the basics. What are scope 3 emissions? And why do they matter?
The very first step of developing a robust climate target or net zero roadmap is working out the total amount of greenhouse gas (GHG) emissions in a company's value chain, and understanding what's driving those emissions. This is known as a GHG baseline, and it provides a crucial reference point as you identify your emission hotspots and define corrective actions to address those emissions.
With a GHG baseline in hand, most companies will realise that scope 3 emissions make up the bulk of their emissions. Scope 3 emissions stem from the activities within a company's value chain that are outside of its direct control. Examples include any emissions generated through livestock farming for the production of leather, or land-use change emissions from the cultivation of soybeans (which might end up in a soy latte). Given that production inputs can come from thousands of different suppliers spread across the globe, collecting emissions data across an entire supply chain can be extremely challenging.
All sound a bit abstract? Time to bring in the ice cream.
There are a number of elements that contribute to the scope 3 emissions of one scoop of delicious chocolate ice cream. Let's look at them in the graphic below.
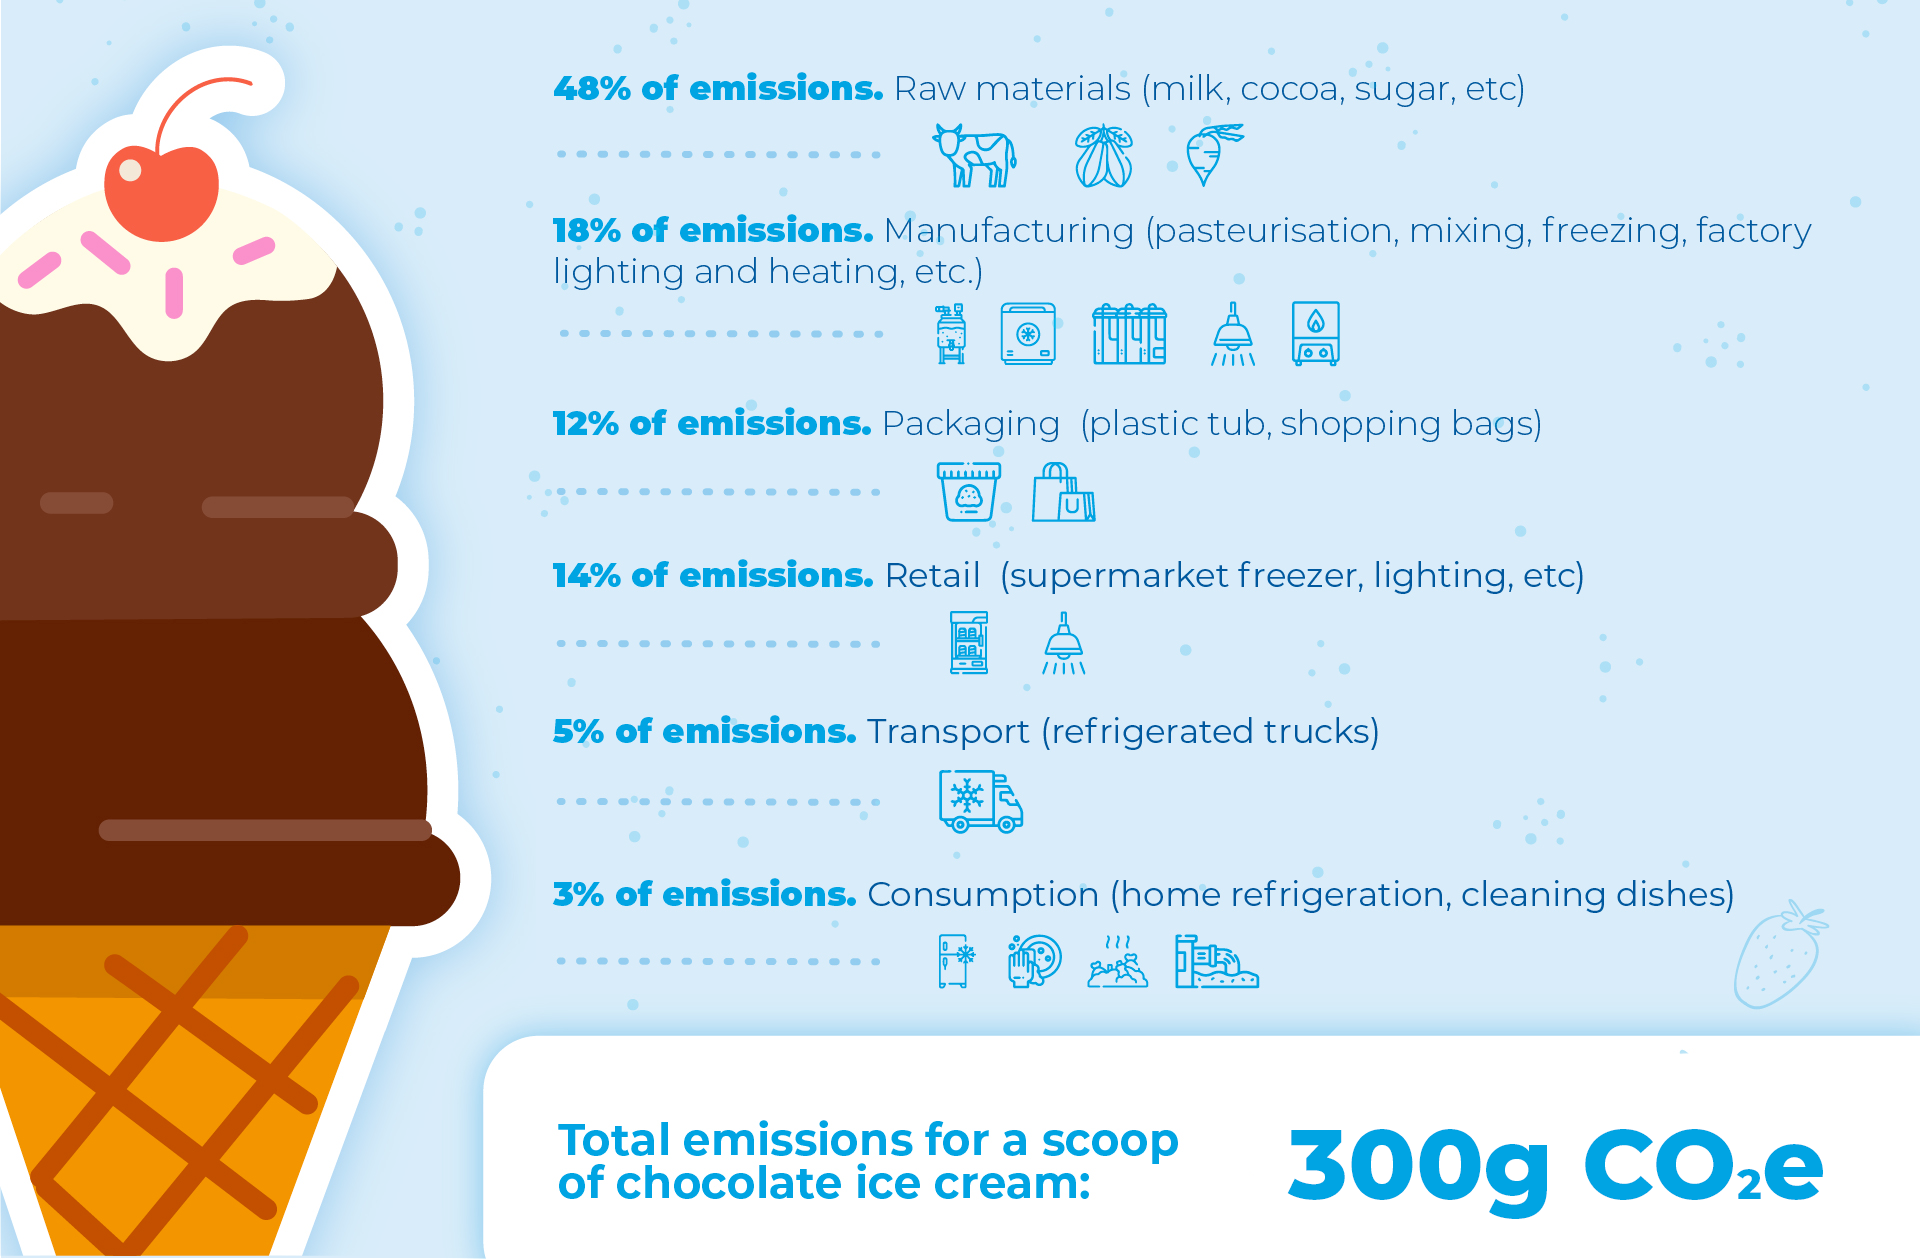
The emissions of a scoop of chocolate ice cream. Assumes one scoop of ice cream = 80 g. Data derived from Environmental impacts of ice cream, Who Knew Ben & Jerry's Could Save the World Through Ice Cream?, and internal sources. Does not include emissions related to the cone.
Taken together, the emissions associated with the raw ingredients, packaging, transport, sale and consumption of one scoop of chocolate ice cream add up to about 300g of CO2 equivalent.
You may also have noticed that the emissions come from many different sources. How do you achieve an understanding of emissions at that level of detail for each step of the ice cream's value chain? And how can your organisation track the scope 3 emissions of its own products?
The first step is to determine what type of data you need and what data can be made available from within your organisation and across your supply chain. But this can be tricky. If you have hundreds of suppliers across the globe, who in turn have hundreds of their own suppliers, then collecting data from each individual supplier is, well… pretty much impossible.
But we're in luck, because there are robust methods to approximate this data.
Let's use our ice cream as an example. If we know that we purchased 1,000 tonnes of milk and 100 tonnes of cocoa for our ice cream, we can estimate the GHG emissions associated with the production of these ingredients by applying average emissions factors for these products. Emissions factors model the amount of GHG emissions associated with an average unit of production.
For our chocolate ice cream, it might be difficult to get emissions data from every single farm, but an average emissions factor for milk and cocoa can be used to assemble a GHG footprint for these inputs. We can also apply emissions factors for activities like processing or transportation.
That sounds pretty straightforward, right? For organisations, the main challenge is getting the internal data to which these emissions factors will be applied, so knowing the volumes and types of purchased ingredients is key, along with knowing how the ingredients were shipped from your suppliers to your production facilities. In many cases, this data collection process can take up to several months, especially when that data is spread across an organisation.
Remember: an emissions factor represents an average amount of GHG emissions for a given product. But there are many different emissions factors out there for a single product, so the choice of emission factors is important.
Efforts should focus on making sure that the emissions factors used are representative of each company's supply chain. Variables can include geography, land-use change, or production processes.
The location from which you source your cocoa beans, for example, can have a huge effect on the total emissions. Cocoa beans from regions with high deforestation rates are usually also associated with higher emissions. Finding an emissions factor that comes closest to specific supply chain characteristics is one of the most critical parts of determining scope 3 emissions.
Once the bulk of the work has been done and the data and the emissions factors have been identified, the total emissions for the product – in our case, a scoop of ice cream – can finally be calculated.
This approach represents the first step in calculating your scope 3 GHG emissions, but your results should be interpreted with caution. Instead of striving for 100% accuracy, the results should serve as a first indication that can be useful for highlighting emission hotspots and helping organisations identify projects to reduce their emissions.
Before implementing any major changes in your supply chain, it is important to understand how different suppliers operate. The milk or cocoa that goes into making that delicious ice cream may come from various suppliers with different land management practices, whether that be no-till farming, cover crop usage, or agroforestry. The best way to track emissions relating to a certain type of land-use change is by collecting primary data from strategic suppliers. This primary data can help identify which exact emission reduction measures should be implemented. The Greenhouse Gas Protocol Land Sector and Removals Guidance is the go-to guide for companies that want to calculate their land-related GHG emissions using primary data.
While this may all seem complex, the good news is that South Pole has a large team of experts who specialise in calculating scope 3 emissions for our clients. So while you sit back (and finally take a bite of that delicious dessert), we can build on a rich base of foundational knowledge and help you calculate your scope 3 emissions before that ice cream melts away.

We can help you navigate the different steps involved in developing scope 3 emissions calculations.